


Short version: Local Services Ads charge you per lead. Search ads charge you per click. They are different machines with different controls, so don’t judge them on lead count or cost per lead. Follow each channel’s leads to booked appointments and closed jobs, set the most you can pay from your own ticket size and close rate, and move budget each month toward the channel that books jobs for the least.
Plain definitions
- Local Services Ads (LSA): Google’s pay-per-lead ads for service businesses, shown at the top of many local searches.
- Search ads: Google’s regular text ads, paid per click.
- Cost per lead: spend divided by every call and form, including wrong numbers, job seekers and price shoppers.
- Cost per converted lead: spend divided by leads that turned into an appointment.
- Cost per closed job: spend divided by jobs that closed.
Ask an owner which ad channel works and they’ll point at whichever one rings the most. That’s the wrong scoreboard. Leads are not jobs.
A lead that never books a visit cost you money and gave you nothing. The real question is what each channel costs per lead that becomes an appointment, and then per closed job.
Two different machines
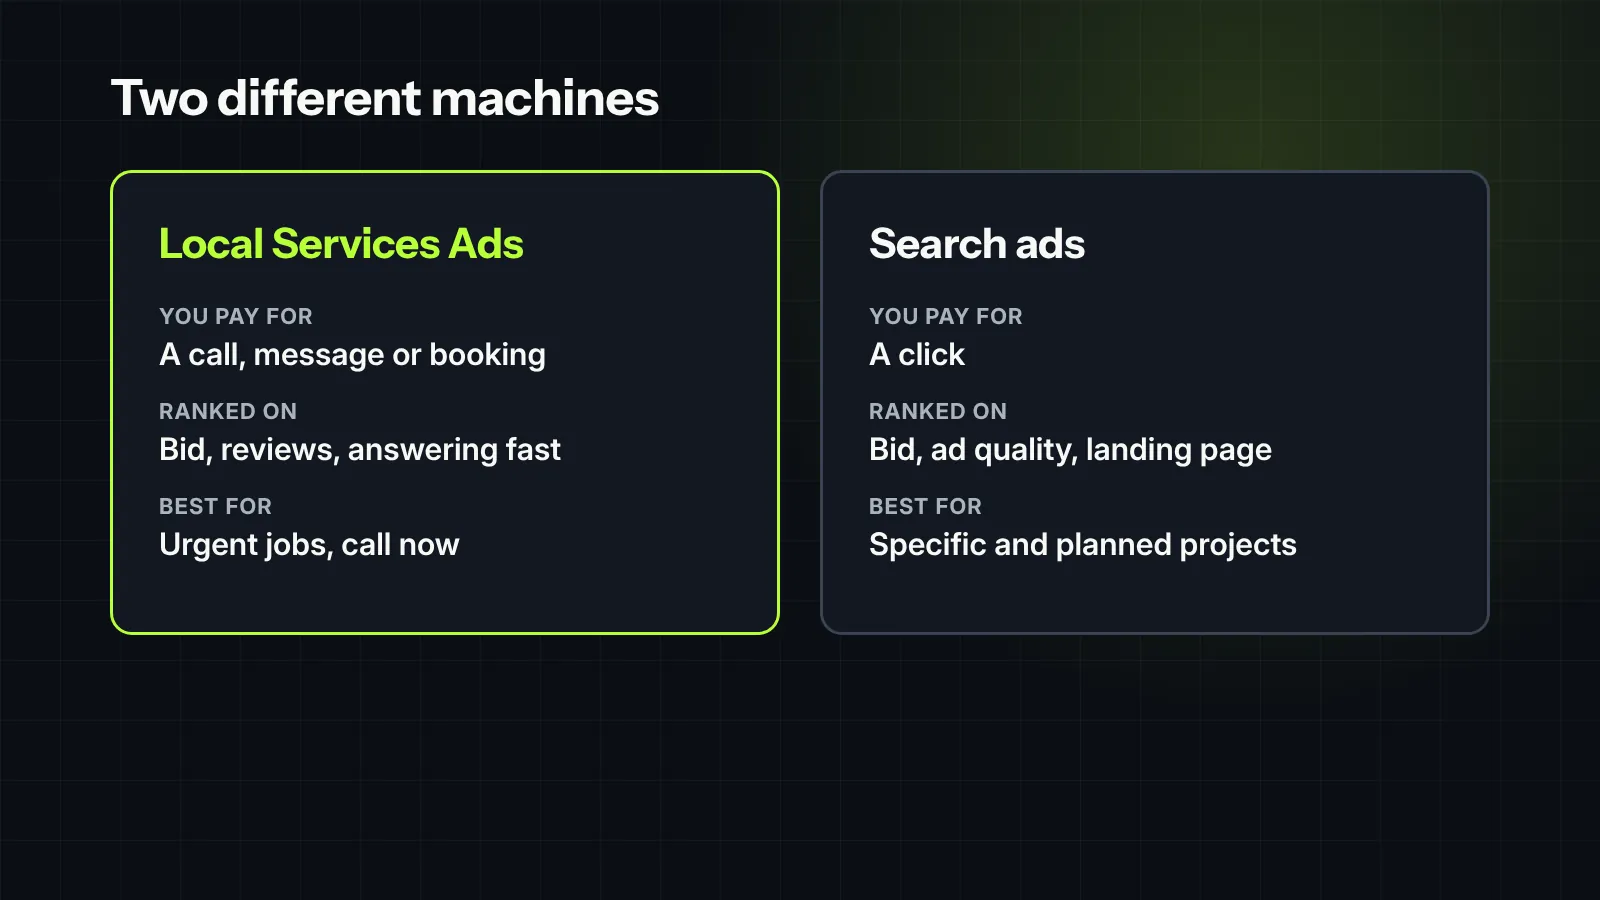
Search ads are the mall arcade in 1994: every quarter goes in whether you win or not. Local Services Ads only charge when a homeowner actually calls, messages or books. That one difference changes what you control, what you pay for and what can go wrong.
| Local Services Ads | Search ads | |
|---|---|---|
| You pay for | A lead: a call, message or booking request | A click |
| Ranked on | Your bid, how likely you are to get the lead, reviews, how fast you answer, a complete and verified profile | Your bid, ad quality, the page the click lands on |
| What you control | Job types, service area, bid, budget, hours | Keywords, ad copy, bids, landing pages, schedule |
| Where the lead lands | Inside Google, usually a call | Your website, as a call or a form |
| Best for | Urgent, local jobs where people want to call now | Specific services and planned projects |
The number that settles it
Here are two channels, each with 100 leads. One looks cheap. Follow each lead to a closed job and the order flips.
These numbers are made up to show the method. Swap in your own.
| Channel A | Channel B | |
|---|---|---|
| Cost per lead | $40 | $90 |
| Leads (illustrative) | 100 | 100 |
| Spend | $4,000 | $9,000 |
| Booked appointments | 30 | 75 |
| Closed jobs | 6 | 22 |
| Cost per converted lead | $133 | $120 |
| Cost per closed job | $667 | $409 |
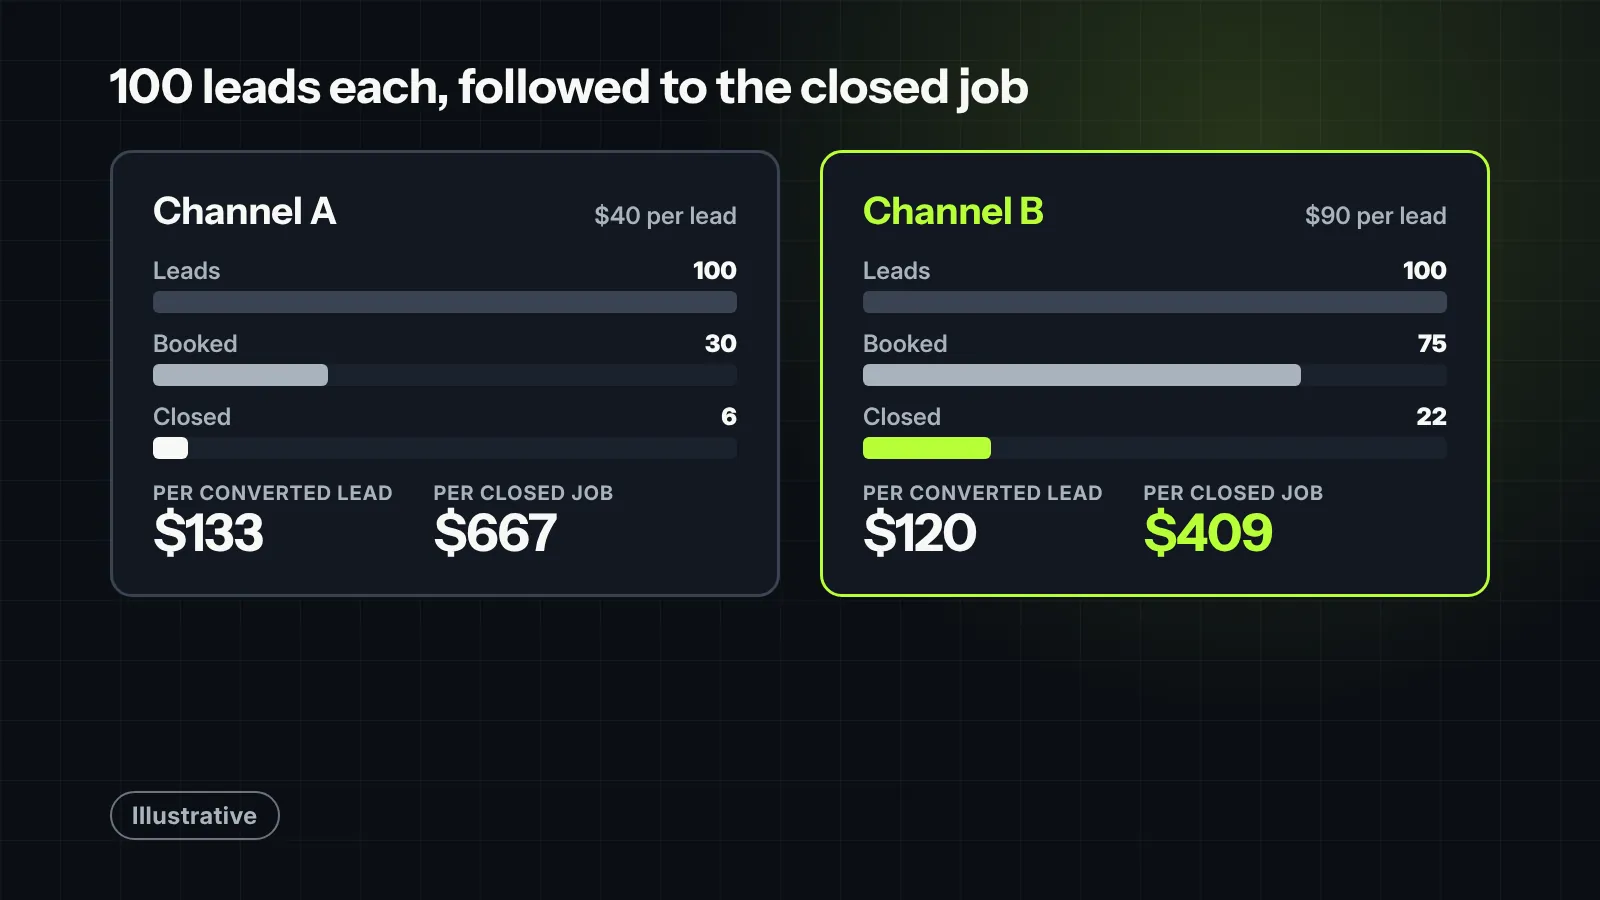
Channel A’s leads cost less than half as much, but most of them never book. Per closed job, it’s the expensive channel. The same math, source by source, is in why your cheapest lead source can cost the most per closed job.
Work back from the job
You don’t need an industry benchmark to know what you can pay. Your own ticket size, close rate and margin set the limit.
- Revenue per converted lead = average ticket × close rate.
- Target ceiling = revenue per converted lead × the share of revenue you budget for marketing.
- Break-even = average ticket × gross margin × close rate. Above this, every converted lead loses money.
Move the sliders to your own numbers. The starting values are illustrative.
| Input or result | Illustrative value |
|---|---|
| Average ticket | $9,000 |
| Close rate on booked appointments | 35% |
| Gross margin | 45% |
| Marketing budget as a share of revenue | 10% |
| Revenue per converted lead | $3,150 |
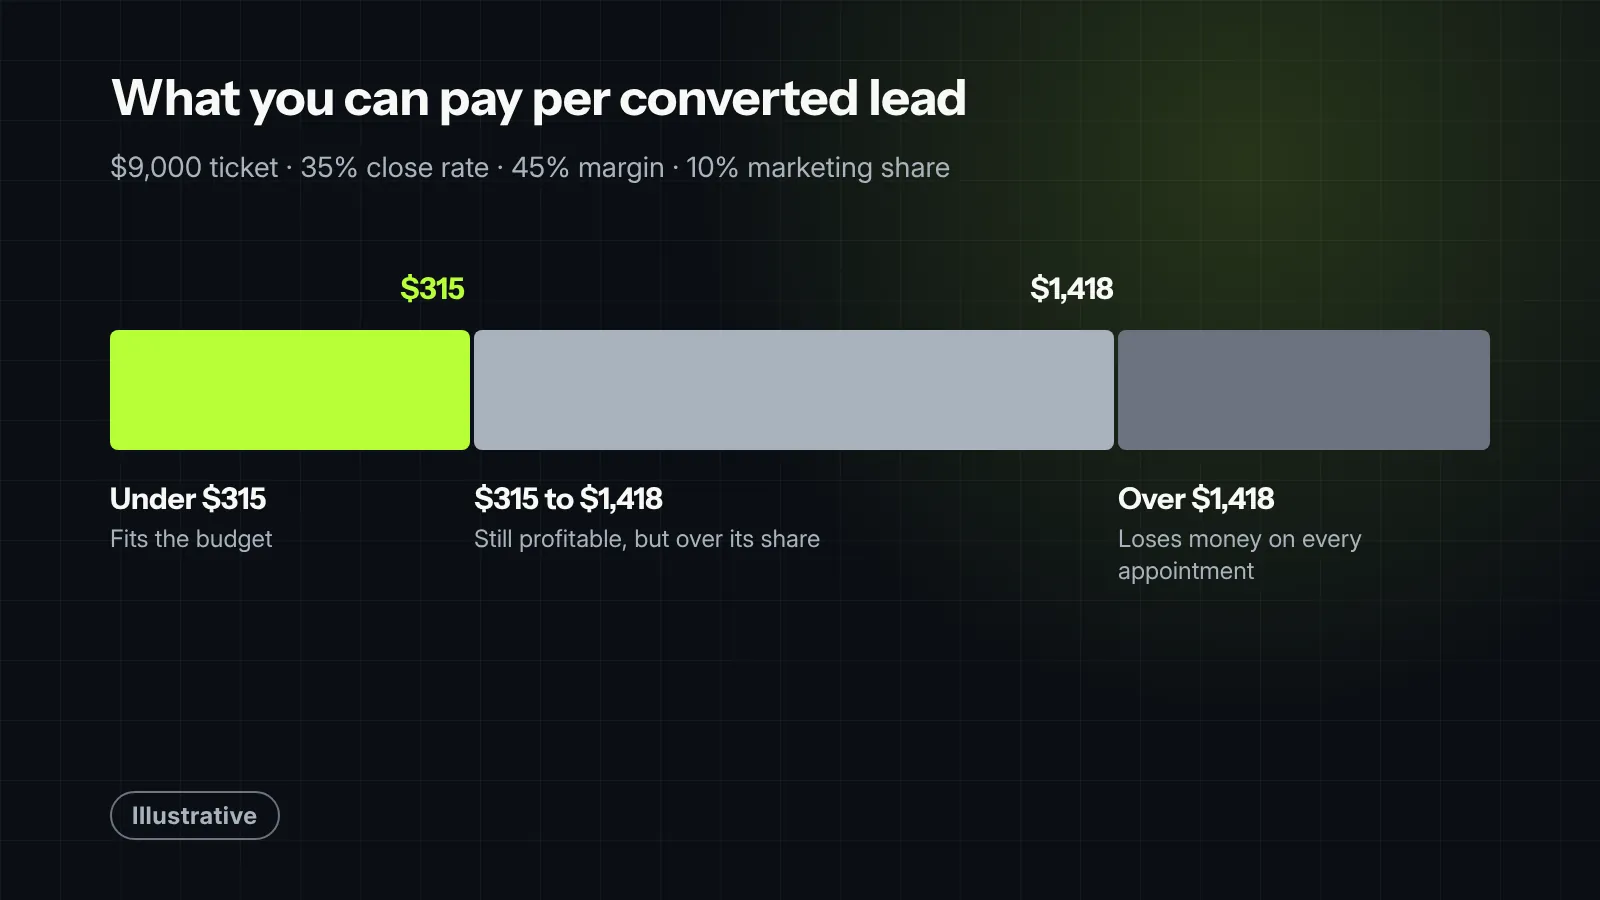
| Target ceiling per converted lead | $315 |
| Break-even per converted lead | About $1,418 |
At the starting values: if a channel books appointments under $315, it fits the budget. Between $315 and $1,418 it still makes money, but it’s eating more than its share. Over $1,418, it loses money on every appointment.

Field note
Google Local Services Ads feel cheap because you only pay for leads, but paying for a lead doesn’t mean you made a profit. We often see operators set their maximum bid based on gut feeling or what competitors claim they pay. Running the actual math across your average ticket, close rate, and target margin usually reveals a very different target ceiling. When you calculate your true break-even cost per converted lead, you can set target bids that aggressively win high-ticket jobs while pulling back before a campaign starts eating into your gross margin.
Running Local Services Ads like an operator
Local Services Ads reward the companies that answer the phone. Miss the call and Google notices. So does your ranking.
Google’s help page on how Local Services Ads are ranked lists the factors: your bid, how likely you are to get the lead, how relevant your services are to the search, and the quality of your profile. Profile quality includes your reviews, how quickly and consistently you respond, high-quality images and completed verification. Google says missed calls may hurt your responsiveness.
- Answer every call. Staff the hours your ads run, or turn on message and booking leads for the hours you can’t.
- Pick job types carefully. Opt out of jobs you don’t want. Paying for the wrong job type is paying for a lead you’ll turn down.
- Keep reviews coming. Rating and review count are part of profile quality.
- Read the leads inbox every week. Mark each lead booked or not, and dispute the ones that don’t qualify. Disputes are covered in exclusive vs. shared leads.
Search ads that don’t leak
Search ads leak in predictable places:
- One campaign for everything. Roof repair, replacement and gutters share a budget, so the cheapest clicks win, not the best jobs.
- Broad keywords with no negatives. You pay for “how to fix a roof leak” and “roofing jobs near me.”
- Ads running when nobody answers. Clicks at 9 p.m. go to voicemail.
- Every click lands on the home page. The searcher has to hunt for the service they asked about.
Structure fixes most of it:
- One campaign per service, so each gets its own budget and its own page.
- Split by urgency. Emergency searches like “leak” and “storm damage” run only while CSRs can answer. Planned searches like “repair cost” land on a service page with a form.
- One shared negative keyword list on every campaign: DIY, how to, jobs, salary, free and anything else that never becomes a job.
- Review the search terms report monthly. Add new negatives from what you paid for and shouldn’t have.
Where Performance Max, Meta and direct mail fit
Local Services Ads and Search ads capture demand that already exists. Other channels create it. Both matter, but they’re judged differently, and mixing them in one report hides what each is doing.
- Performance Max: mostly capture, across all of Google. It’s only as good as the conversion data you feed it, so send it booked jobs, not just calls.
- Meta: creates demand. It puts you in front of homeowners before they search, so judge it over months, not weeks.
- Direct mail: creates demand. It targets homes by age, value or storm path. Track it with unique numbers and codes, as covered in direct mail for home services.
Deciding the split
There’s no right percentage. There’s a monthly loop:
- Measure cost per converted lead and cost per closed job, by channel.
- Compare each channel against your ceiling and against the others.
- Shift 10 to 20% of budget toward the leader.
- Measure again. Did its cost hold as spend went up?
Repeat every month. Stop shifting when the leader’s cost per converted lead starts to climb. That’s the point where more money buys worse leads.
What we would check first in your account
- Whether each channel’s leads are tracked through to booked and closed in your CRM.
- Your Local Services Ads answer rate and the job types you’re paying for.
- Search terms you paid for last month that could never become a job.
- Whether your ads run during hours nobody answers the phone.
- Your ceiling and break-even per converted lead, from your own numbers.
Want help with this? See our Local Services Ads and Google Ads work.


