


Short version: Cost per lead only measures the top of the funnel. A cheap source can lose more leads at every step after that: fewer reached, fewer booked, fewer closed. Track each source all the way to closed jobs, and rank sources by cost per closed job, not cost per lead.
Plain definitions, because these metrics sound alike
- Cost per lead: what you spent on a source divided by the leads it produced.
- Converted lead: a lead that turned into an appointment. Cost per appointment is spend divided by appointments.
- Close rate: the share of appointments that become closed jobs.
- Cost per closed job: a separate metric. What you spent on a source divided by the jobs that actually closed.
Every lead report starts with cost per lead because it is the easiest number to get. The platform hands it to you on a plate. It is also the number most likely to send your budget the wrong way.
The cheapest lead is like the cheapest dial-up plan, that screechy 90s internet: great price, terrible time loading anything. What you actually want to know is what it costs to get a job on the board.
Every lead source leaks at different steps
A lead has to survive four steps before it pays you anything. Somebody has to reach the homeowner. The homeowner has to book. The appointment has to happen. And it has to close.
Each source loses people at different points. A cheap source might be full of wrong numbers, so you lose a lot at “reached.” Another might reach people easily but attract price shoppers, so you lose them at “closed.” The invoice only shows the first step.
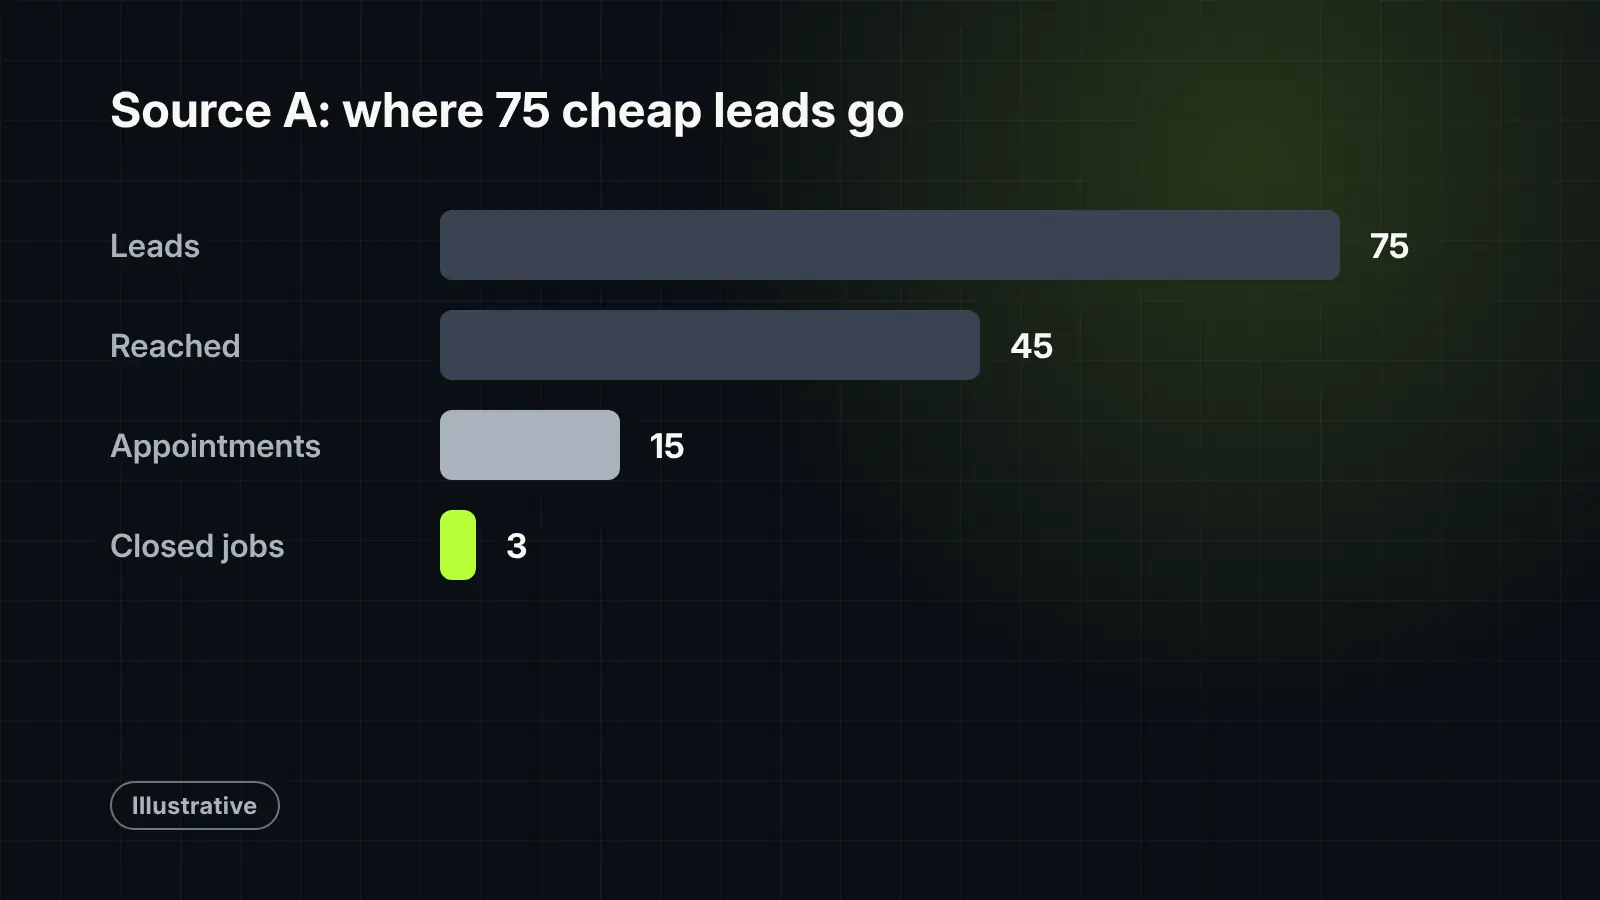
The math, with illustrative numbers
These numbers are made up to show the method. They are not benchmarks, so swap in your own.
Say you spend $3,000 a month on each of three sources.
| Source A | Source B | Source C | |
|---|---|---|---|
| Cost per lead (illustrative) | $40 | $100 | $150 |
| Leads | 75 | 30 | 20 |
| Appointments (illustrative) | 15 | 15 | 12 |
| Cost per appointment | $200 | $200 | $250 |
| Closed jobs (illustrative) | 3 | 6 | 6 |
| Cost per closed job | $1,000 | $500 | $500 |
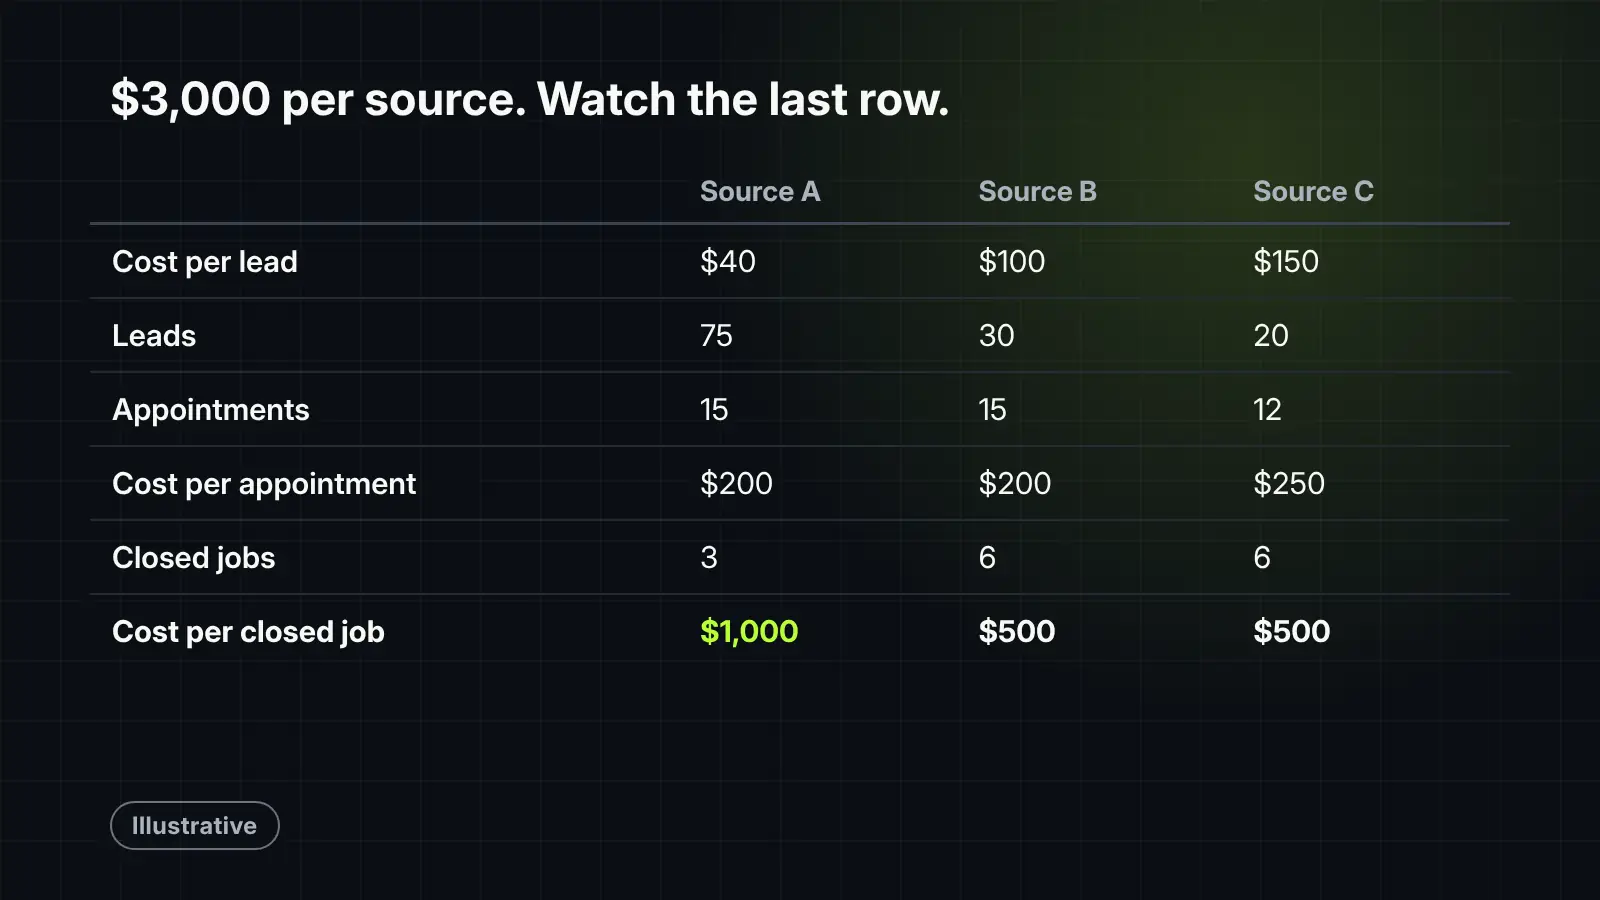
Look at it the way most reports do and Source A is the winner. Its leads cost less than half of B’s. It even ties B on cost per appointment.
Now look at the last row. Source A costs twice as much per closed job as B or C. And Source C, the most expensive lead on the list, is tied for the cheapest job.
Ranked by cost per lead, you would move money into A. Ranked by cost per closed job, you would move money out of it.
Cost per lead hides three other costs
Even cost per closed job leaves something out, because it only counts what you paid the source. Cheap leads usually cost more in three places that never show up on the invoice.
- Call-center time. In the example, Source A sends 75 leads. If each one takes 15 minutes of calls, texts and notes, that is nearly 19 hours a month, most of it spent on leads that go nowhere.
- Sales time. An appointment that was never going to close still costs a salesperson the drive, the inspection and the follow-up.
- Smaller tickets. Sources full of price shoppers tend to close at lower prices. Two sources with the same cost per closed job can still be very different if one brings in bigger jobs.
You don’t need perfect numbers for these. A rough estimate is enough to stop a cheap-looking source from winning by default.
Run the numbers by source, not by month
Most owners see marketing as one number per month: total spend, total leads. That hides which source is doing the work. Here is how to see it by source.
- Tag the source on every lead. Use a fixed list in your CRM, the same spelling every time. Call tracking numbers make this automatic for phone leads.
- Carry the source through to the job. The appointment and the closed job should keep the lead’s original source, so you can count closed jobs by source.
- Pull spend by source. From each platform’s billing, for the same date range.
- Build one table. Spend, leads, appointments, closed jobs and revenue for each source. Then divide.
- Give it time. Some jobs close weeks after the lead came in. Look at a full quarter before you cut a source.
If you can’t get closed jobs by source yet, start with cost per appointment. It is already much closer to the truth than cost per lead.
When the cheap source still earns its spot
A high cost per closed job doesn’t always mean “cut it.” Keep it if one of these is true, and you have checked it with numbers.
- It fills capacity you’d otherwise waste. If crews are idle, a pricier job can still beat no job.
- The problem is fixable on your side. If leads are being reached slowly or not at all, faster follow-up may bring the numbers in line. Fix that first, then judge the source.
- The jobs are worth more. If the source’s jobs are bigger or bring repeat work, a higher cost per closed job can still be the better deal.
Otherwise, move the budget to the sources that cost less per closed job, and watch the next quarter.
Related: Lead aggregators: when buying leads pays off and when it does not.

Field note
It’s easy to get caught up in the vanity of a cheap cost per lead. We’ve audited accounts where a $40 lead source looked like the undisputed champion on the monthly summary sheet—until we traced those leads all the way down to closed jobs and realized they were bleeding thousands.
Getting your attribution setup right is the key to measuring the real success of these platforms. Once you tag every lead correctly and carry that source through your pipeline, you can monitor lead quality closely and provide frequent feedback to weed out the noise. Tighten your service categories whenever you can to filter out tire-kickers and maximize the high-value jobs that actually pay.
What we would check first in your account
- Whether every lead in your CRM has a source, and whether that source carries through to the closed job.
- Cost per lead, cost per appointment and cost per closed job for each source over the last full quarter.
- Which source has the biggest gap between its cost per lead rank and its cost per closed job rank.
- How much call-center and sales time goes to leads from each source.
- Average ticket by source, so you are comparing jobs of similar value.
Want help building this view? See our lead generation and reporting work.


