


Short version: An owner needs five numbers every month: leads by source, booking rate, close rate, average ticket and cost per closed job. Together they tell you whether marketing is working and, when it isn’t, which part of the business to fix. Clicks, impressions and rankings belong in your marketer’s report, not yours.
Plain definitions, because these metrics sound alike
- Lead: a new potential customer who called, filled out a form or messaged you.
- Converted lead: a lead that turned into an appointment. Booking rate is appointments divided by leads.
- Close rate: closed jobs divided by appointments that actually happened.
- Average ticket: revenue from closed jobs divided by the number of closed jobs.
- Cost per closed job: a separate metric. Marketing spend divided by the jobs that actually closed.
Most marketing reports measure activity. Impressions, clicks, rankings, a chart going up and to the right. It looks busy. It rarely tells an owner whether to spend more, spend less or fix something.
Think of the box score in the morning paper after a 90s Bulls game. You didn’t need every stat to know how the night went. You needed a few that told the story. Here are the five that tell yours.
1. Leads, by source
Not total leads. Leads by source: Google Ads, Local Services Ads, organic search, your Business Profile, referrals, mail and so on. A total can go up while your best source quietly drops.
Count new customers only. Existing customers calling about a warranty, vendors and spam don’t belong here.
2. Booking rate
Of the leads that came in, how many became appointments? This is the scoreboard for your phones and your intake.
When booking rate drops, look at missed calls, speed of follow-up and how calls are handled before you blame marketing. A good source can look bad if half its calls go to voicemail.
3. Close rate
Of the appointments that actually happened, how many closed? This is the scoreboard for sales, and it is also a lead quality check.
If one source’s close rate is far below the others, the problem may be the leads, not the salespeople. Compare close rate by source before you change anything.
4. Average ticket
Revenue divided by closed jobs. It catches a problem the other numbers miss: a source that closes plenty of jobs, but small ones.
Track it by source and by service line. A month full of repairs can hit every other target and still leave revenue short.
5. Cost per closed job, by source
Marketing spend divided by closed jobs. This is the number that decides where next month’s money goes. Compare it with what a closed job is worth to you.
It is also the number most reports leave out, because it needs CRM data, not just ad platform data. That is exactly why it matters.
One page, two months, side by side
These numbers are made up to show the method. Swap in your own.
| Last month | This month | |
|---|---|---|
| Leads (illustrative) | 100 | 120 |
| Booking rate | 50% (50 appointments) | 45% (54 appointments) |
| Close rate | 40% (20 closed jobs) | 35% (19 closed jobs) |
| Average ticket | $9,800 | $9,500 |
| Marketing spend | $14,000 | $15,200 |
| Cost per closed job | $700 | $800 |
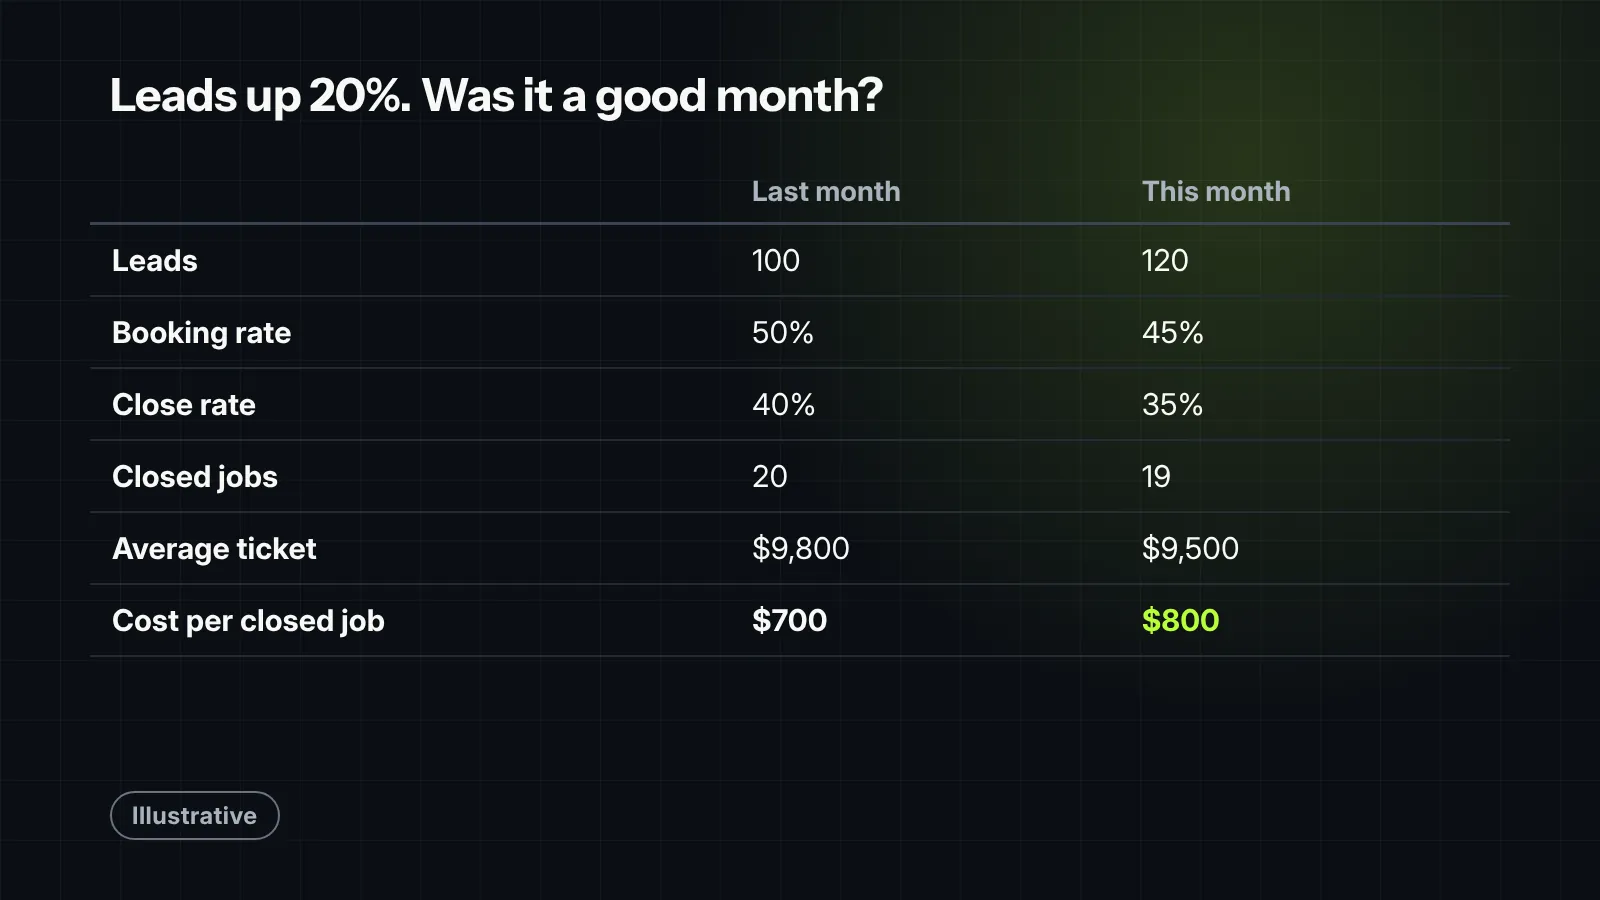
Leads went up 20%. A report that stops at leads calls this a great month. The full page says otherwise: fewer closed jobs, smaller tickets, and each job cost $100 more.
Add a column per source and the same page tells you which source caused it.
How the five numbers point to the fix
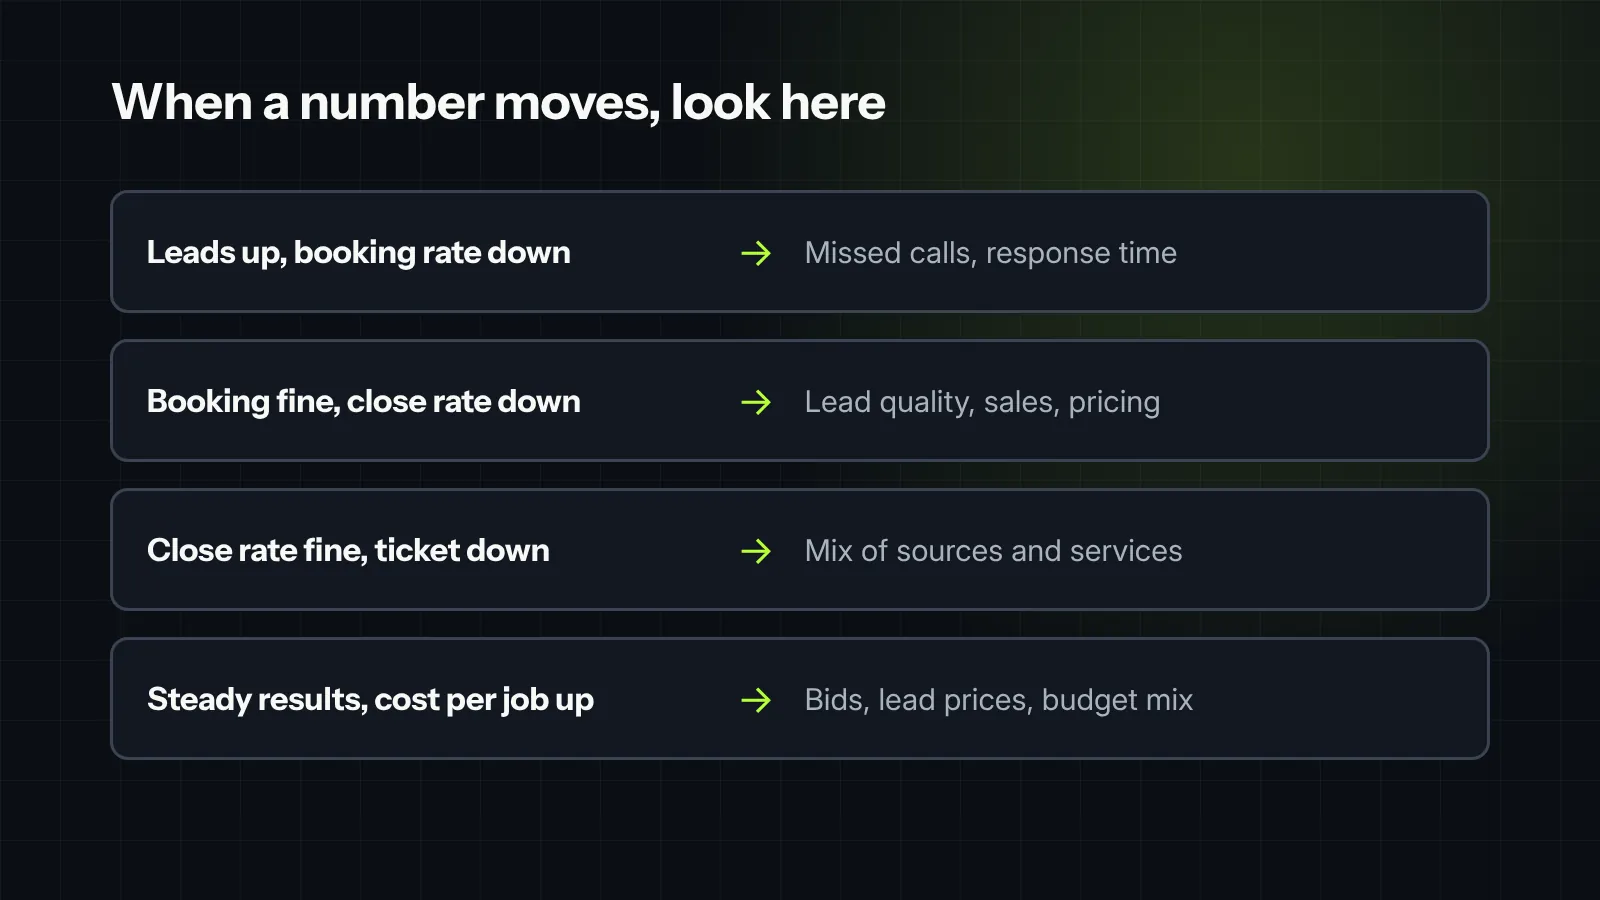
The numbers matter most when they move. Each pattern points to a different part of the business.
- Leads up, booking rate down. Intake can’t keep up. Check missed calls, response time and after-hours coverage.
- Booking rate fine, close rate down. Look at lead quality by source first, then the sales process and pricing.
- Close rate fine, average ticket down. The mix shifted toward smaller jobs. Check which sources and services grew.
- Everything steady, cost per closed job up. You are paying more for the same results. Check bids, lead prices and which sources got more budget.
Set a target for each number
A number with no target is just trivia. Write one down for each, based on your own last 6 to 12 months, not someone else’s benchmark.
- Leads by source: the volume each source needs to deliver to fill your schedule.
- Booking rate: the rate your best month hit, as the bar for the team.
- Close rate: by source, since some sources naturally close lower.
- Average ticket: by service line, so a busy repair month doesn’t look like a failure.
- Cost per closed job: the most you can pay and still make the margin you want on an average job.
Then look at the gaps, not just the numbers. “Close rate is 35%” means little. “Close rate is 5 points under target on marketplace leads” tells you where to look.
Watch the lag before you panic
Jobs don’t close the day the lead comes in. A roof replacement or an HVAC system can take weeks of estimates and follow-ups. So last month’s close rate will keep rising for a while after the month ends.
- Re-run the prior month when you run the new one. You will see it fill in.
- Judge a source on a full quarter, not one month, before you cut it.
- Look weekly at leads and booking rate, which move fast, and monthly at close rate and cost per closed job, which settle slowly.
What to leave out of the owner’s report
Impressions, clicks, click-through rate, rankings and followers are useful to the person running the campaigns. They are inputs, not results.
If your report leads with them and never mentions closed jobs, ask why. The answer is usually that nobody connected the marketing data to the CRM. That is fixable. See getting booked and closed data out of your CRM.
Related: why your cheapest lead source can cost the most per closed job.

Field note
Every month, we put the same five numbers in front of owners: leads by source, booking rate, close rate, average ticket, and cost per closed job. Marketing dashboards are great at hiding bad news inside flashy green charts, but keeping it to these five core metrics keeps everyone honest.
In one account, top-level lead volume and revenue looked completely steady. But breaking out those five numbers revealed a hidden bleed: while leads by source looked healthy for a newly expanded market, the booking rate and close rate in that zone were bottoming out. That dragged their cost per closed job through the roof on jobs with an average ticket that didn’t justify the drive time. The high-level report completely masked the issue, but looking at those five specific metrics caught the drain before it wiped out the quarter’s margins.
What we would check first in your account
- Whether you can see all five numbers today, by source, without building a spreadsheet by hand.
- Whether leads are counted as new customers only, with existing customers and spam filtered out.
- Booking rate and close rate by source for the last full quarter.
- Whether marketing spend by source lines up with the same dates as your CRM data.
- Which source has the highest cost per closed job, and how much budget it gets.
Want a report built around these five? See our reporting and analytics and attribution work.


